Three Insights from Tracking MRR
Leverage your monthly recurring revenue analytics

Monthly recurring revenue (MRR) is one of the simplest subscription metrics we can capture. When MRR goes up that’s good and when it goes down that’s bad — obviously.
There’s so much more we can do with MRR. It’s low-hanging fruit if you are invested in using data to make decisions and draw conclusions… you just need to know how to use it.
Looking at a final MRR number is the equivalent of looking at the balance total in your bank account each month. If you want actionable insights, you have to dig deeper.
Segment MRR by Revenue Type
You can categorize MRR similar to labeling your spending as groceries, entertainment, rent, etc. Start with four categories: expected, new, expansion, and churn.
- Expected MRR is the revenue that was expected for that month. These are the dollars from existing customers that have made no changes.
- New MRR is the revenue from brand new customers for that month. Depending on how you organize accounts, cross-sell may be included here.
- Expansion MRR is the revenue from existing customer upsell. Be sure to only include recurring revenue upsells.
- Churn MRR is the revenue lost from churn. Represent this as a negative number for easier aggregate graphing.
Now you’ll have the data to back up statements like “although MRR decreased, lots of new customers is promising for future months” or “despite an overall increase in MRR, the lack of new business is concerning”.
Chartio has a good resource showing how segmenting MRR by revenue type empowers you to produce better analytics.

Segment MRR by Product
If you sell multiple products or different tiers of one product, then segmenting MRR based on offering will help you identify which offerings are excelling and which are underperforming.
For example, a software that offers three tiers of subscriptions will be able to monitor each independently. An even spread will generally conclude that things are good; however, offerings with disproportionately lower MRR may need to be investigated.
Curious how the new add-on feature is affecting MRR? Separating it as standalone MRR or performing correlate analysis on the MRR of accounts that adopted the feature can answer your questions.

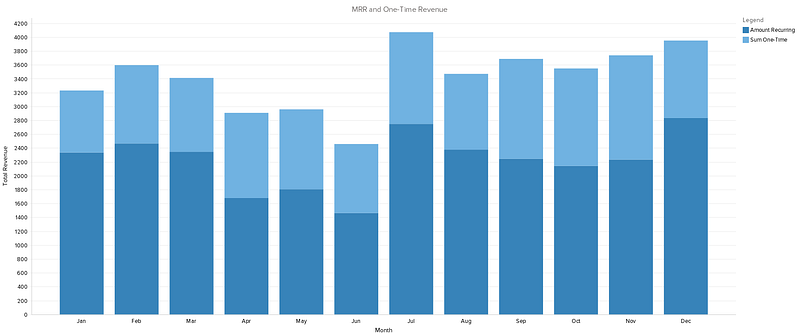
Contrast MRR Against One-Time Revenue
If your company sells one-time offerings such as professional services or training, then you need to track MRR against it.
Non-recurring revenue can be a masking agent when evaluating the health of your portfolio. Since this is money that will not be coming back, you cannot count on it during the following period. As a result, that gap must be aggressively filled to keep revenue where it was.
Looking at the following chart, after a down month in August, total revenue increased in September. However, this increase was due to non-recurring revenue as MRR in fact dropped for a second month in a row.
Monthly recurring revenue is a great metric to get started with because it is easy to calculate and simple to understand. But, do not settle for ground-level basic insights. Use these three strategies to get more out of your MRR analytics.
Thanks for reading. Please share your experiences, questions, and comments below!